7 in 7 Data Visualization - Major Studio 2 AssignmentIndividualMajor Studio 2PARSONS MFA DTSpring 2012 Feb 7 Written By Lauren Slowik SOFT SCIENCE - A DATA VISUALIZATION 7IN7 1 - book scans that included images 7IN7 2 - books by relative size 
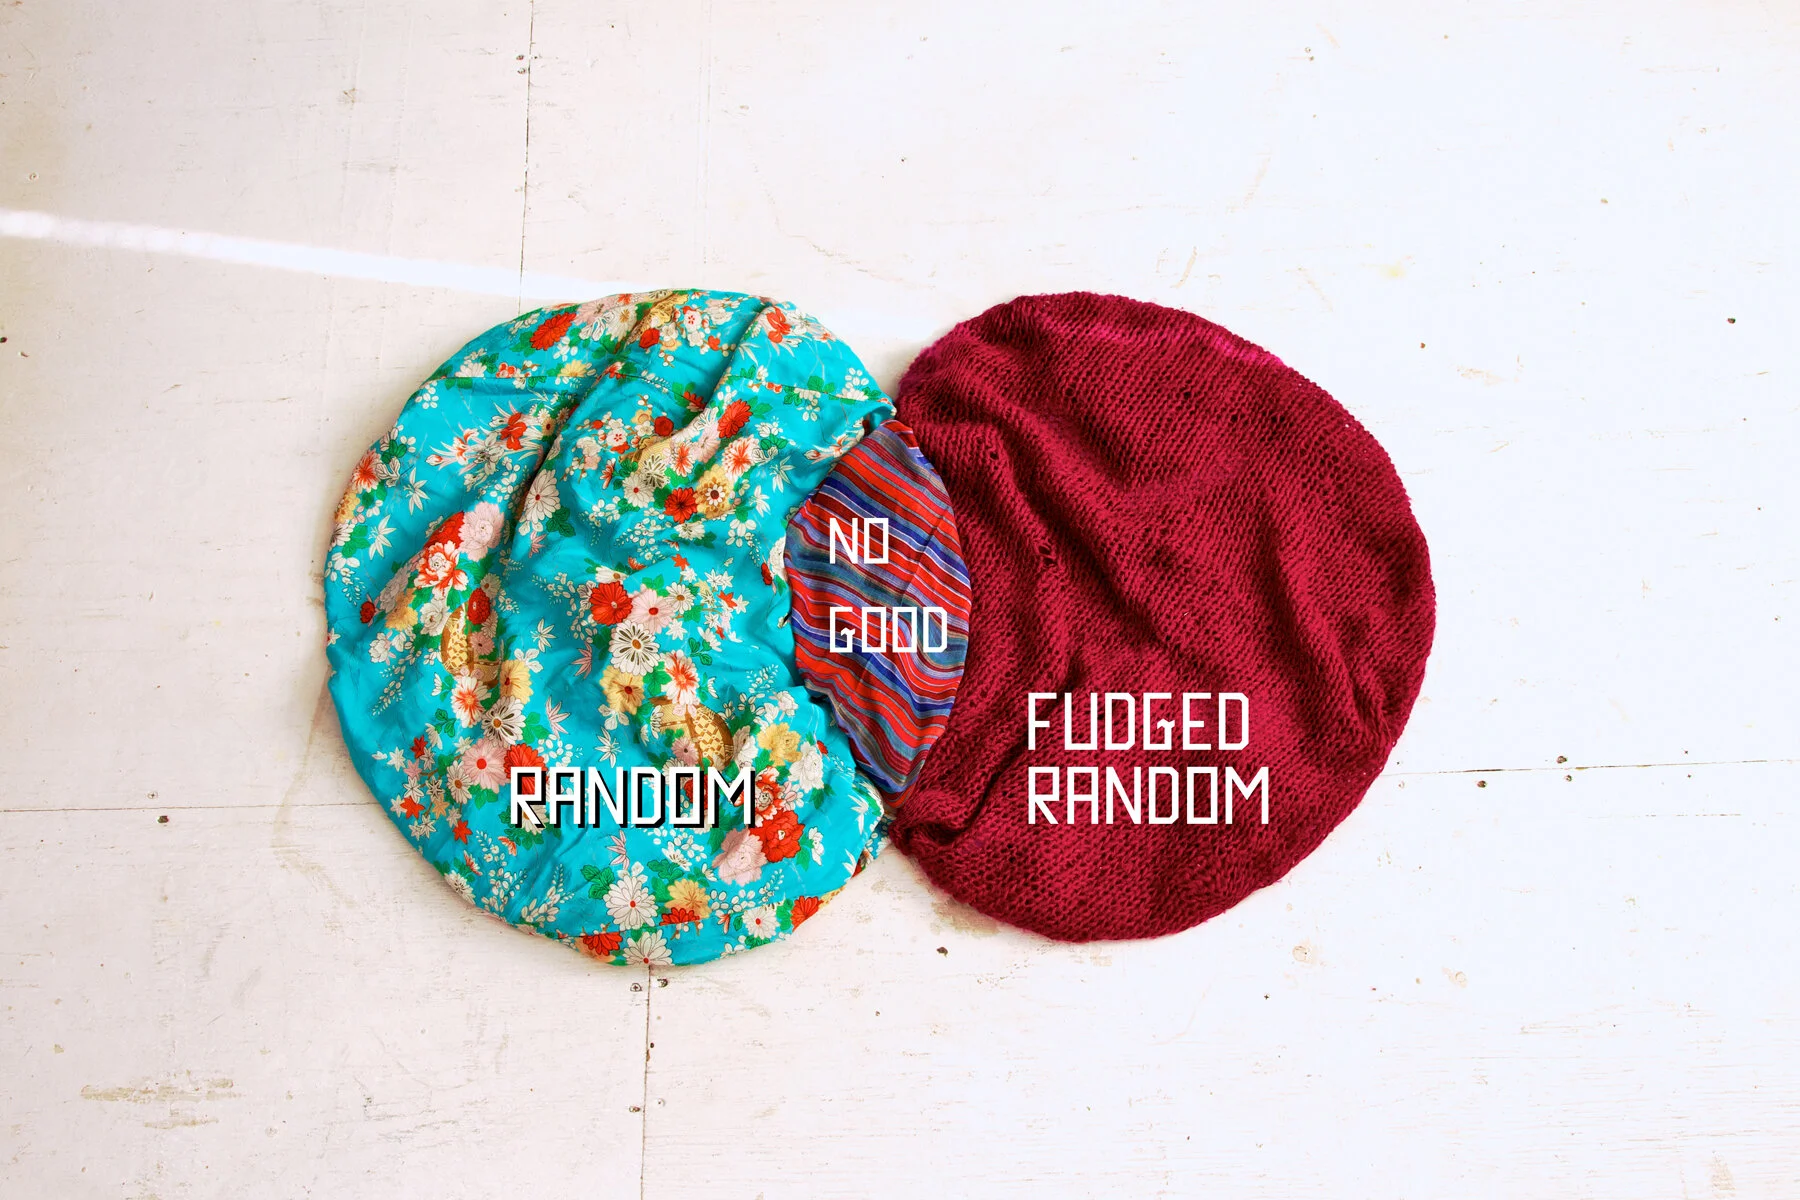
7IN7 3 - how often I stuck with my algorithm 7IN7 4 - number salad 7IN7 5 - book topics, outliers excluded 7IN7 6 - relative amounts gained, as perceived by me 7IN7 7 - Numbers tell a story For more information on the process and the inspiration see the previous post. 7 by 77 in 7data visualizationfabricinspirationlibraryParsonsVenn diagrams Lauren Slowik